Summary
If you've got a sensor that isn't within range of wifi, then LoraWAN is a good solution. And event-based rules in picos are a convenient way to process the data.

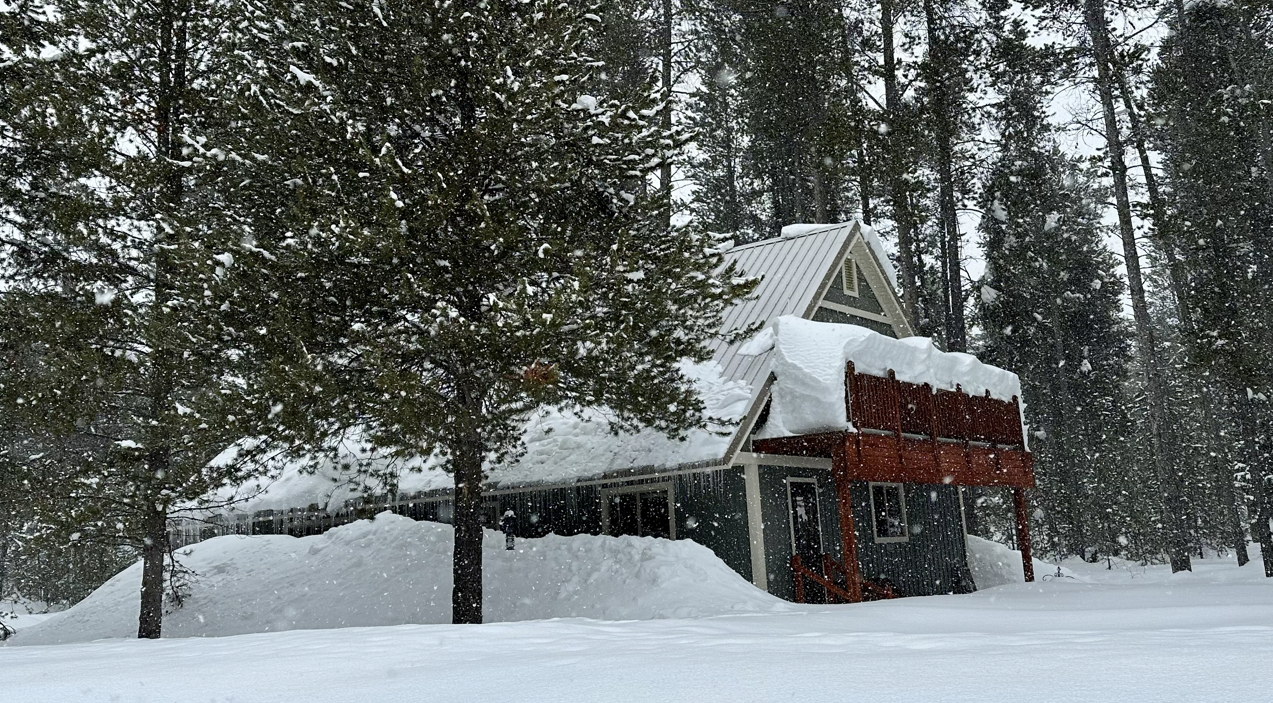
I've got a pumphouse in Island Park, ID that I'm responsible for. Winter temperatures are often below 0°F (-18°C) and occasionally get as cold as -35°F (-37°C). We have a small baseboard heater in the pumphouse to keep things from freezing. That works pretty well, but one night last December, the temperature was -35°F and the power went out for five hours. I was in the dark, unable to know if the pumphouse was getting too cold. I determined that I needed a temperature sensor in the pumphouse that I could monitor remotely.
The biggest problem is that the pumphouse is not close to any structures with internet service. Wifi signals just don't make it out there. Fortunately, I've got some experience using LoraWAN, a long-range (10km), low-power, wireless protocol. This use-case seemed perfect for LoraWAN. About a year ago, I wrote about how to use LoraWAN and a Dragino LHT65 temperature and humidity sensor along with picos to get temperature data over the Helium network.
I've installed a Helium hotspot near the pumphouse. The hotspot and internet router are both on battery backup. Helium provides a convenient console that allows you to register devices (like the LHT65) and configure flows to send the data from a device on the Helium network to some other system over HTTP. I created a pico to represent the pumphouse and routed the data from the LHT65 to a channel on that pico.
The pico does two things. First it processes the hearthbeat event that Helium sends to it, parsing out the parts I care about and raising another event so other rules can use the data. Processing the data is not simple because it's packed into a base64-encoded, 11-byte hex string. I won't bore you with the details, but it involves base64 decoding the string and splitting it into 6 hex values. Some of those pack data into specific bits of the 16-bit word, so binary operations are required to seperate it out. Those weren't built into the pico engine, so I added those libraries. If you're interested in the details of decoding, splitting, and unpacking the payload, check out the receive_heartbeat rule in this ruleset.
Second, the receive_heartbeat rule raises the lht65:new_readings event in the pico adding all the relevant data from the LHT65 heartbeat. Any number of rules could react to that event depending on what needs to be done. For example, they could store the event, alarm on a threshold, or monitor the battery status. What I wanted to do is plot the temperature so I can watch it over time and let other members of the water group check it too. I found a nice service called IoTPlotter that provides a basic plotting service on any data you post to it. I created a feed for the pumphouse data and wrote a rule in my pumphouse pico to select on the lht65:new_readings event and POST the relevant data, in the right format, to IoTPlotter. Here's that rule:
  rule send_temperature_data_to_IoTPlotter {
    select when lht65 new_readings

    pre {
      feed_id = "367832564114515476";
      api_key = meta:rulesetConfig{["api_key"]}.klog("key");
      payload = {"data": {
                    "device_temperature": [
                      {"value": event:attrs{["readings", "internalTemp"]},
                       "epoch": event:attrs{["timestamp"]}}
                    ],
                    "probe_temperature": [
                      {"value": event:attrs{["readings", "probeTemp"]},
                       "epoch": event:attrs{["timestamp"]}}
                    ],
                    "humidity": [
                      {"value": event:attrs{["readings", "humidity"]},
                       "epoch": event:attrs{["timestamp"]}}
                    ],
                    "battery_voltage": [
                      {"value": event:attrs{["readings", "battery_voltage"]},
                       "epoch": event:attrs{["timestamp"]}}
                    ]}
                };
    }

    http:post("http://iotplotter.com/api/v2/feed/" + feed_id,
       headers = {"api-key": api_key},
       json = payload
    ) setting(resp);
 }
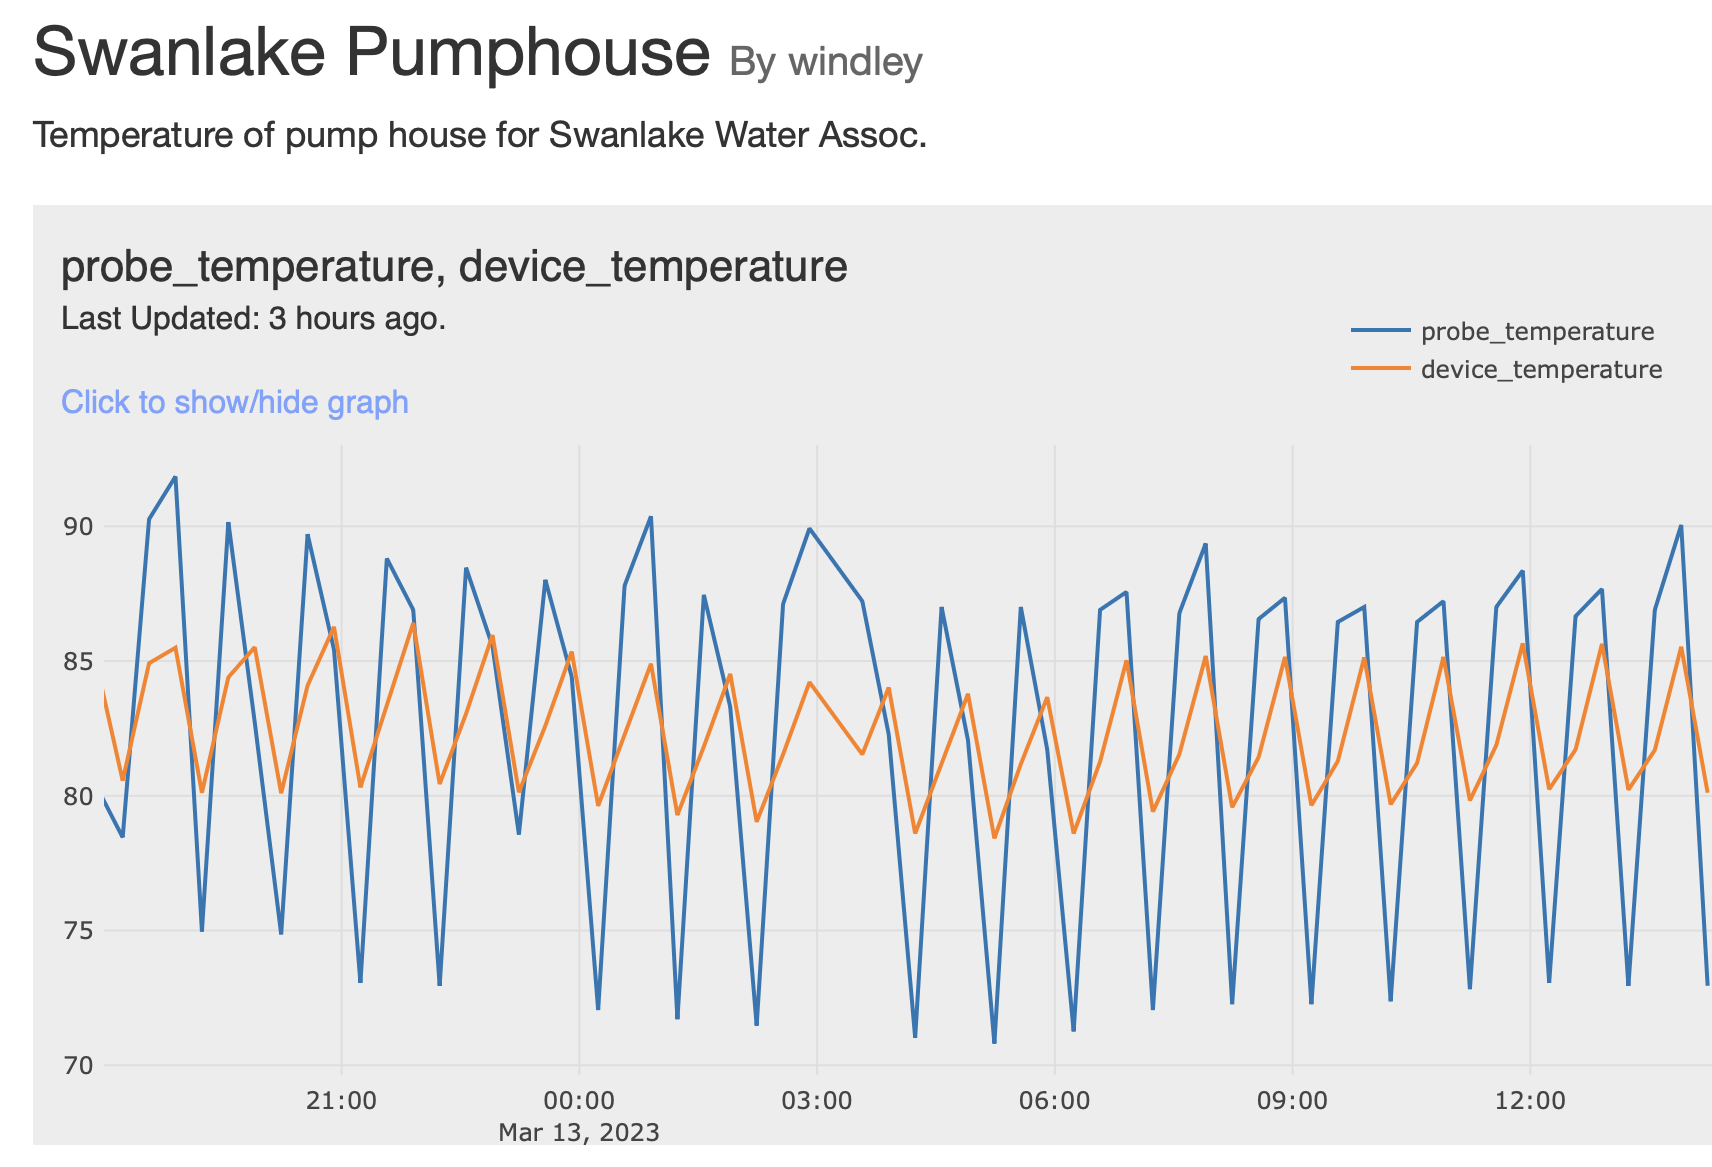
The rule, send_temperature_data_to_IoTPlotter is not very complicated. You can see that most of the work is just reformatting the data from the event attributes into the right structure for IoTPlotter. The result is a set of plots that looks like this:

Pretty slick. If you're interested in the data itself, you're seeing the internal temperature of the sensor (orange line) and temperature of an external probe (blue line). We have the temperature set pretty high as a buffer against power outages. Still, it's not using that much power because the structure is very small. Running the heater only adds about $5/month to the power bill. Pumping water is much more power intensive and is the bulk of the bill. The data is choppy because, by default, the LHT65 only transmits a payload once every 20 minutes. This can be changed, but at the expense of battery life.
This is a nice, evented system, albeit simple. The event flow looks like this:

I'll probably make this a bit more complete by adding a rule for managing thresholds and sending a text if the temperature gets to low or too high. Similarly, I should be getting notifications if the battery voltage gets too low. The battery is supposed to last 10 years, but that's exactly the kind of situation you need an alarm on—I'm likely to forget about it all before the battery needs replacing. I'd like to experiment with sending data the other way to adjust the frequency of readings. There might be times (like -35°F nights when the power is out) where getting more frequent results would reduce my anxiety.
This was a fun little project. I've got a bunch of these LHT65 temperature sensors, so I'll probably generalize this by turning the IoTPlotter ruleset into a module that other rulesets can use. I may eventually use a more sophisticated plotting package that can show me the data for all my devices on one feed. For example, I bought a LoraWAN soil moisture probe for my garden. I've also got a solar array at my house that I'd like to monitor myself and that will need a dashboard of some kind. If you've got a sensor that isn't within easy range of wifi, then LoraWAN is a good solution. And event-based rules in picos are a convenient way to process the data.


